With Placement | VTU-Approved | Vijaynagar, Bangalore | 2026 Batch Open
Vtricks Technologies offers a job-focused data analytics course in Bangalore at our Vijaynagar campus steps from the metro. You learn SQL, Python, Power BI, and Excel through 30+ live projects built on real company datasets. The 2026 curriculum also covers GenAI tools for analysts natural language to SQL, AI-assisted dashboards, and Copilot in Power BI skills none of the older courses teach. Designed for freshers and career-switchers alike. No coding background needed.
₹32,000 all inclusiveVTU-Approved InstituteNear Vijaynagar MetroWeekday & Weekend BatchesPlacement Support IncludedNo Coding Background Needed
Get Course Details Free Callback in 24 hrs
Data Analytics Course in Bangalore with Placement
Bangalore generates more demand for data analysts than any other city in India. Every major IT company, fintech startup, e-commerce platform, and GCC operating out of Bangalore runs on data and they all need people who can extract it, clean it, analyse it, and turn it into decisions. The problem is that most training courses still teach tools in isolation, with no context for how a real analytics team actually works. That is the gap the data analytics course in Bangalore at Vtricks Technologies is built to close.
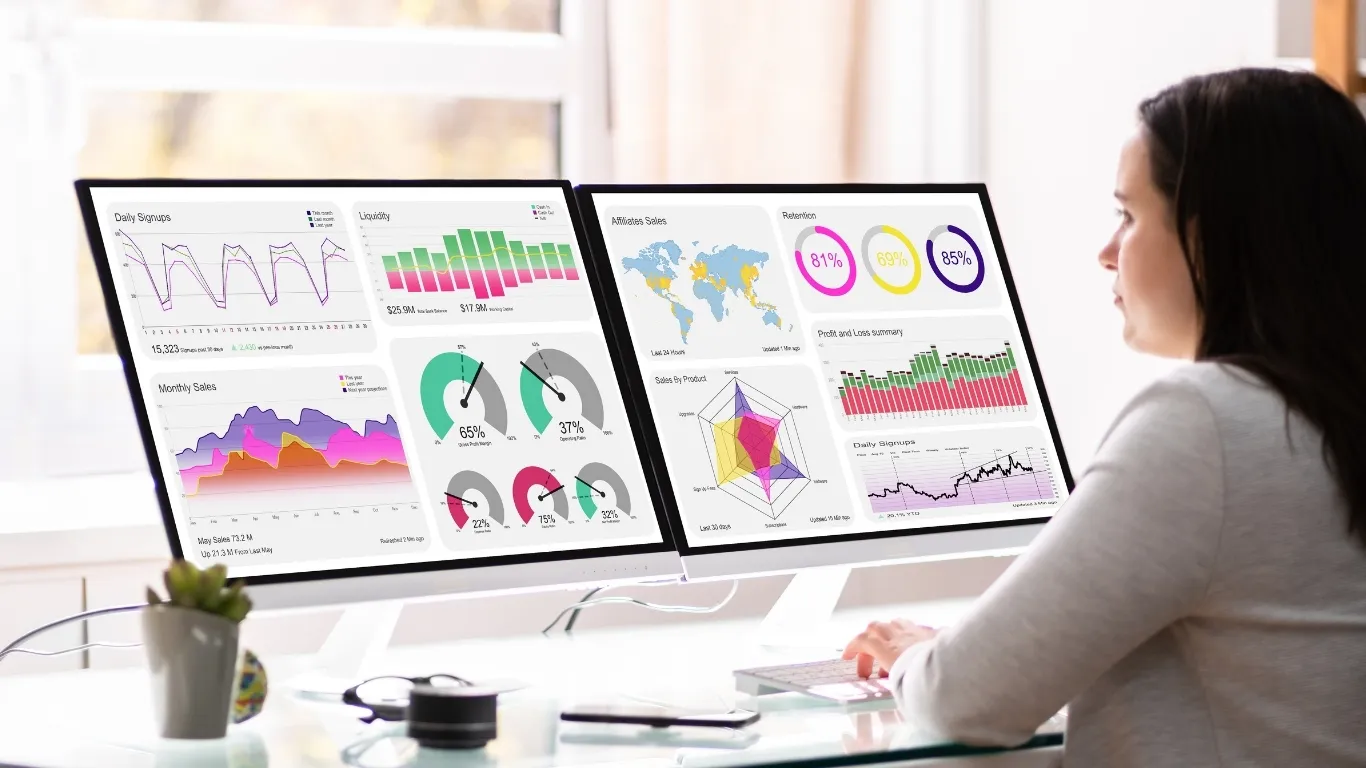
The course is structured around the actual workflow of a data analyst not a textbook outline. You start with data: where it comes from, how to pull it using SQL, and how to clean it using Python libraries like Pandas and NumPy. You then move into analysis descriptive statistics, hypothesis testing, regression and finally into communication, building dashboards in Power BI and Tableau that stakeholders can actually read and act on. Excel and Advanced Excel run through the entire course because most Bangalore companies still rely on it for day-to-day reporting.
The 2026 curriculum at Vtricks includes something most data analytics training institutes in Bangalore have not added yet a dedicated module on GenAI tools for analysts. This covers writing SQL using natural language prompts, using AI to explain dashboard patterns, and working with Copilot inside Power BI. These are skills that Bangalore hiring managers are starting to ask about in interviews, and getting ahead of them now makes a difference.
Training at Vtricks is delivered at our Vijaynagar campus a short walk from Vijaynagar Metro Station with batch sizes kept small so every student gets direct access to the trainer. The people teaching this data analytics training in Bangalore have held analyst, data science, and BI roles in companies themselves. They do not just know the tools they know what gets asked in interviews, what mistakes freshers typically make in the first three months on the job, and how to help you avoid them. Whether you are a fresher just out of college, a professional switching from a non-IT background, or someone upskilling from an adjacent role, the course is designed to take you from where you are to job-ready.
Our Data Analytics Placements
Real students. Real companies. Real data analyst roles from our Bangalore batches.
Navyashree T E
Data Analyst @ Sigmoid Analytics
100% Salary Hike
Deepu R
Business Analyst @ Tech Mahindra
Non-IT to Data Analyst
Prajwal Manjunath
Data Analyst @ Accenture
Placed in 90 Days
Navyashree T E
Data Analyst @ Sigmoid Analytics
100% Salary Hike
Deepu R
Business Analyst @ Tech Mahindra
Non-IT to Data Analyst
Prajwal Manjunath
Data Analyst @ Accenture
Placed in 90 Days
Overview of Data Analytics Course In Bangalore
Last updated: July 2026 · New weekday & weekend batches enrolling now
Once you finish the Data Analytics Course in Bangalore at Vtricks, you’ll get a certification that shows you’ve actually understood the core concepts and not just gone through the syllabus. It mainly covers things like Data Visualization, Data Mining, and the kind of statistical methods that are used regularly in Data Analytics work. Adding this certificate to your resume can make a noticeable difference, especially when recruiters are quickly scanning profiles.
The course itself includes different parts of data science such as Excel, Advanced Excel, Tableau, and SQL. But it’s not just theory-based. You’ll be working on tasks and small projects alongside the learning, which makes it easier to connect what you study with how it’s used in real situations.
A lot of people who are trying to get into this field usually start by searching for a data analytics course near me or a data analyst course in Bangalore, and that’s where Vtricks comes in. The training doesn’t just stop after the course is done. There’s also support when it comes to placements, along with guidance on how to approach opportunities. That way, once you complete the data analytics certification course in Bangalore, you’re not left figuring everything out on your own.
These days, Data Analytics is being used almost everywhere. Whether it’s to understand user behavior, improve engagement, or just make better decisions, data plays a big role behind the scenes. And it’s not limited to finance or investment-related fields anymoreindustries like healthcare, retail, and marketing depend on Data Analytics in different ways. Bengaluru, being India’s tech capital, hires more data analysts than any other Indian city, which makes it the right place to build this skill and get placed fast.
100+ hours of hands-on practical learning with real use cases.
Work on 6 industry-level projects along with multiple case studies.
Get lifetime access to course materials and recorded sessions.
Training designed with a strong focus on placement readiness.
Access classroom training across multiple locations in Bangalore.
Learn directly from certified Data Analytics professionals.
Unlimited interview opportunities with access to an internal job portal.
Best Data Analytics Training in Bangalore
Industry trainers, not just instructors
Training at Vtricks is led by Vinay Haritsa a data science professional and alumnus of Amrita University with hands-on experience in Python, machine learning, and business analytics. Every session is built around real problems he has worked on in industry, not textbook examples. You can ask questions mid-session, revisit concepts, and get direct feedback on your project work without waiting for an email reply.
30+ live projects on real company datasets
Every module includes hands-on project work using actual datasets from e-commerce, fintech, and healthcare companies. By the time you finish, you have a GitHub portfolio with 6 completed industry-level projects and a set of Power BI dashboards you can show directly in job applications. This is what interviewers in Bangalore actually ask to see and most candidates from other institutes cannot show it.
VTU-approved certification not just a participation certificate
Vtricks Technologies is a VTU-approved training partner and an IBM, Microsoft, and AWS recognized institute. The certificate you receive on completing this data analytics course in Bangalore reflects demonstrated project output and assessed skill not just course completion. Recruiters screening profiles in Bangalore treat VTU-approved certifications differently from self-issued ones.
Small batches maximum 15 students per batch
Batch sizes at Vtricks are capped so every student gets direct trainer access in every session. No crowded classrooms, no questions going unanswered. Weekday morning, weekday evening, and weekend batches are available. The campus is at 15th Main Road, Vijayanagar a 5-minute walk from Vijayanagar Metro Station accessible from Rajajinagar, Nagarbhavi, Basaveshwaranagar, and Malleshwaram.
500+
Students Placed Since 2019
7+
Years of Industry-Expert Trainers
30+
Live Projects Per Batch
Data Analytics Course Syllabus & Tools Covered
The data analytics course in Bangalore at Vtricks Technologies is structured around what a working analyst does from data extraction to dashboard delivery. Every module includes hands-on labs with real datasets.
Module
Topics Covered
Duration
Module 1
Data Analytics Fundamentals types of analytics, industry use cases, analyst workflow, statistics basics
2 Weeks
Module 2
SQL for Data Analytics queries, joins, subqueries, window functions, CTEs, data extraction
3 Weeks
Module 3
Python for Data Analytics Pandas, NumPy, data cleaning, reshaping, feature preparation
4 Weeks
Module 4
Data Visualization Matplotlib, Seaborn, Power BI (DAX, modeling, dashboards), Tableau
3 Weeks
Module 5
Excel for Business Reporting Advanced Excel, pivot tables, Power Query, business dashboards
2 Weeks
Module 6 2026 New
GenAI Tools for Data Analysts natural language to SQL, AI-assisted chart explanation, Copilot in Power BI, prompt engineering for analytics
2 Weeks
Module 7
Capstone Projects 2 industry-level projects across fintech and e-commerce with real datasets, GitHub portfolio submission
4 Weeks
Tools & Technologies You Will Learn
Hands-on training with every tool used in Bangalore data analyst roles in 2026.
SQL (MySQL, PostgreSQL)
Python (Pandas, NumPy, Matplotlib, Seaborn)
Microsoft Excel & Advanced Excel
Power BI (DAX, data modeling, row-level security)
Tableau
GitHub (portfolio and version control)
GenAI tools Copilot, NL-to-SQL, AI dashboard tools
Real-Time Industry Datasets
Data Analytics Course Fees & Duration in Bangalore
The data analytics course fees in Bangalore at Vtricks Technologies is ₹32,000 all-inclusive, with no hidden charges for tools, datasets, certification, or placement support. EMI starts from ₹1,499 per month. Unlike most institutes in Bengaluru that quote ₹45,000–₹80,000 with add-ons, the fee here is flat across every batch format. Choose the batch that fits your schedule:
Batch Type
Duration
Schedule
Mode
Fee
Weekday Morning
3–4 Months
Mon–Fri, 1.5 hrs/day
Classroom (Vijaynagar)
₹32,000
Weekday Evening
3–4 Months
Mon–Fri, after office hours
Classroom (Vijaynagar)
₹32,000
Weekend Batch
5–6 Months
Sat–Sun, 3 hrs/day
Classroom (Vijaynagar)
₹32,000
Online Live
3–4 Months
Instructor-led + recordings
Live Online
₹32,000
Every format covers the same full curriculum — SQL, Python, Excel, Power BI, statistics, the 2026 GenAI module, 30+ live projects, and placement preparation from week one. Our data analytics classes in Bangalore are capped at 15 students per batch, so trainer access stays direct in both classroom and online modes.
Data Analyst Course in Bangalore Eligibility & Who Can Join
There is no strict eligibility for the data analyst course in Bangalore at Vtricks. No coding background, no maths degree, no IT experience required — the curriculum starts from Excel and statistics basics and builds up to SQL, Python, and Power BI step by step. Most of our placed students came from non-IT backgrounds.
Your Background
Suitable?
How You Start
Fresher / Recent Graduate (any stream)
Yes
Full curriculum from basics; placement prep from week one
Non-IT Graduate (BCom, BBA, BSc, BA)
Yes
No coding needed to begin; Python taught from scratch
Working Professional (career switch)
Yes
Weekend or weekday evening batch; domain knowledge becomes an advantage
Student after 12th / final-year degree
Yes
Learn alongside studies; internship-style live projects for the resume
IT Professional (upskilling)
Yes
Fast-track through basics; focus on Python, BI, and the GenAI module
If you can work with a laptop and basic Excel, you can complete this data analyst training. Everything else — queries, scripts, dashboards, statistics — is taught inside the course with practice datasets from real Bengaluru companies.
Benefits of Becoming a Data Analyst
Why Bangalore companies are paying ₹3–25 LPA for this skill and why now is the right time to build it.
High demand in Bangalore
Bangalore has the highest concentration of data analyst job openings in India. IT services, fintech, e-commerce, GCCs, and SaaS companies are all hiring and the demand for people who can work with SQL, Python, and Power BI continues to outpace the supply of trained professionals.
Salaries from ₹3 LPA to ₹25 LPA
Entry-level data analysts in Bangalore earn ₹3–6 LPA. Mid-level professionals with 2–4 years of experience move to ₹7–12 LPA. Senior analysts and data leads earn ₹15–25 LPA. Analysts who add GenAI skills to their toolkit are earning 25–35% above these ranges in 2026, according to Naukri job market data.
Work across any industry
SQL, Python, and Power BI skills are transferable across every sector. A data analyst trained on fintech data can move into healthcare, retail, logistics, or marketing analytics without restarting their career. This cross-industry mobility is unique to the data role and gives you options most IT careers do not.
Visible impact on business decisions
Data analysts do not work in the background. Your dashboards go into weekly leadership reviews. Your analysis shapes product decisions, marketing budgets, and operational changes. The role gives you direct visibility into how companies make decisions and you are the one providing the evidence they act on.
Accessible to non-IT backgrounds
MBA graduates, commerce students, science graduates, and working professionals from non-IT domains regularly transition into data analyst roles. Santoshi P joined Vtricks from an MBA Business Analytics background with no programming experience and got placed through the Vtricks placement program after completing the course.
Future-proof with GenAI skills
Data analytics is evolving fast. Natural language to SQL, AI-assisted dashboards, and Copilot in Power BI are already in production at Bangalore companies. The 2026 curriculum at Vtricks includes a dedicated GenAI module so you leave the course ahead of candidates trained on older programs.
Career Opportunities & Salary for Data Analysts in Bangalore
Completing the data analytics course in Bangalore at Vtricks opens doors to six high-growth roles that Bangalore companies are actively hiring for in 2026. The salary outlook is strong at every level freshers entering as data analysts earn ₹3–6 LPA, mid-level professionals with 2–4 years experience move to ₹7–12 LPA, and senior analysts and BI leads regularly exceed ₹15–25 LPA. Analysts with GenAI tool skills are commanding a 25–35% premium above these ranges. Source: Naukri JobSpeak 2026 India salary data.
Data Analysts extract, clean, analyse, and visualise data to help companies make decisions faster. In Bangalore, this role exists across IT services, fintech, e-commerce, healthcare, and every funded startup. Entry salary: ₹3–6 LPA. Mid-level: ₹7–12 LPA.
Tools: SQL, Python (Pandas), Excel, Power BI, Tableau
Tasks: data cleaning, joins, window functions, dashboard building, ad-hoc reporting
Teams: product, marketing, operations, finance
SQL Developers build and optimise queries, views, and stored procedures that power analytics pipelines and business applications. High demand in Bangalore's IT services and product companies. Salary: ₹4–10 LPA.
Responsibilities: data modelling, reusable datasets, ETL support
Power BI Developers are among the most in-demand profiles in Bangalore in 2026. Companies replacing Excel-based reporting with interactive dashboards need Power BI specialists who know DAX and data modelling. Salary: ₹5–14 LPA.
Skills: DAX measures, data modelling, row-level security, performance tuning
Business Analysts bridge the gap between data teams and business stakeholders. Deepu R transitioned from a non-IT background into a Business Analyst role at Tech Mahindra after completing the Vtricks data analytics course. Salary: ₹5–15 LPA.
Focus: requirements gathering, KPI frameworks, decision support
Junior Data Engineers build the pipelines that feed analytics. This is the natural next role for a data analyst who wants to move into infrastructure and automation. High demand in Bangalore's product and SaaS companies. Salary: ₹6–14 LPA.
Work: scheduled jobs, transformations, data validation, monitoring
Core Python Developers who come from a data analytics background are well positioned to automate reporting workflows, build internal tools, and support ML pipelines. Salary: ₹4–12 LPA.
Skills: Python fundamentals, APIs, data parsing, automation scripts
Bangalore pays the highest data analyst salaries in India. Here is what the market looks like in 2026 based on Naukri JobSpeak data and what you can realistically expect at each stage of your career after completing a data analytics course in Bangalore.
Experience Level
Typical Role
Annual Salary (Bangalore)
Key Skills That Get You There
Fresher (0–1 year)
Junior Data Analyst, Reporting Analyst
₹3 – 6 LPA
SQL, Excel, Power BI basics, Python fundamentals
Mid-Level (2–4 years)
Data Analyst, Business Analyst, BI Analyst
₹7 – 12 LPA
Advanced SQL, Python (Pandas), Power BI DAX, statistical analysis
Senior (5+ years)
Senior Analyst, Data Lead, Analytics Manager
₹15 – 25 LPA
End-to-end analytics ownership, stakeholder management, ML awareness
GenAI-skilled analyst (any level)
Any of the above + GenAI tooling
+25–35% premium
NL-to-SQL, Copilot in Power BI, AI-assisted reporting
Source: Naukri JobSpeak India Analytics Salary Report 2026. Figures represent Bangalore market range across industries.
The fee for the data analytics course at Vtricks Technologies is ₹32,000 all inclusive. At a fresher salary of ₹4 LPA, that investment returns in under two months of employment. EMI is available from ₹1,499 per month, making it accessible without a large upfront commitment. No hidden fees. No separate tool or certification charges. Everything is included in the single course fee.
Why Choose Vtricks for Data Analytics Training in Bangalore?
Vtricks Technologies has been training data analytics professionals from our Vijayanagar campus since 2019. We are a VTU-approved training partner and an IBM, Microsoft, and AWS recognized institute. These are not marketing claims they are verified approvals that determine whether your certificate carries weight with Bangalore recruiters.
Training is led by Vinay Haritsa, a data science professional and alumnus of Amrita University with real industry experience in Python, machine learning, and business analytics. Batch sizes are capped at 15 students so every person gets direct access to the trainer in every session. No crowded classrooms. No recorded sessions as a substitute for live instruction.
Students who have come through this program include career-switchers from MBA, commerce, and non-IT backgrounds not just engineering graduates. Santoshi P came with no programming background from an MBA Business Analytics program and got placed through the Vtricks placement network. Nirmala R completed the September 2023 to January 2024 batch and secured an internship at Epic Minds that led to a full-time role.
The campus is at 15th Main Road, Vijayanagar 5 minutes from Vijayanagar Metro Station. Students travel from Rajajinagar, Nagarbhavi, Basaveshwaranagar, and Malleshwaram. If you have been searching for a data analytics institute in Bangalore near Vijayanagar, this is the closest accredited option to the metro station in that area.
VTU-approved institute certificate recognised by Bangalore recruiters.
IBM, Microsoft and AWS approved training partner since 2019.
Trainer: Vinay Haritsa industry professional, Amrita University alumnus.
Maximum 15 students per batch direct trainer access every session.
Campus on 15th Main Road, Vijayanagar 5 min from metro station.
Open to freshers, career-switchers, and non-IT professionals.
₹32,000 all-inclusive no hidden fees, EMI from ₹1,499/month.
Vtricks vs Other Data Analytics Institutes in Bangalore
Before choosing a data analytics institute in Bangalore, compare what actually affects your learning and placement outcome — batch size, project count, certification type, and total cost:
What to Compare
Vtricks Technologies
Typical Large Institute
Batch Size
Maximum 15 students
40–100+ students per batch
Live Projects
30+ on real company datasets
2–5 template projects
Certification
VTU-approved certification
Institute's own participation certificate
Total Fee
₹32,000 all-inclusive, EMI from ₹1,499/month
₹45,000–₹80,000+ with paid add-ons
Trainer Access
Direct access to industry trainers
Shared doubt-clearing sessions
Placement Prep
Starts from week one
Begins only after course completion
Data Analytics Courses in Bangalore with Placement How It Works
Placement preparation at Vtricks starts from week one not after the course ends. While you are still learning SQL and Python, the team begins working on your professional profile so that by the time you finish the capstone project, your resume and LinkedIn are already employer-ready.
The placement support does not stop at your first offer. Navya N, who completed her data analytics course at Vtricks in 2021, came back years later when she wanted to switch jobs and the team supported her job search again. That kind of ongoing support is not common in Bangalore training institutes and it reflects how the program is structured: your career outcomes matter beyond the course completion date.
Students from recent batches have been placed at companies including Sigmoid Analytics, Tech Mahindra, and Epic Minds. The hiring network continues to grow across Bangalore's IT, fintech, and analytics sectors.
Step 1 Resume & LinkedIn OptimisationProfile built to match what Data Analyst and BI Analyst hiring managers look for in Bangalore job postings including keywords, project descriptions, and quantified outcomes.
Step 2 Mock InterviewsPractice sessions covering SQL (window functions, CTEs), Python (Pandas, data cleaning), statistics (hypothesis testing, p-values), and Power BI (DAX, dashboard walkthroughs) the exact areas Bangalore companies test in data analyst interviews.
Step 3 Job Alerts & ReferralsAccess to the Vtricks hiring network and alumni connections across Bangalore companies. Job opportunities are shared directly with students based on their skill set and preferred domain.
Step 4 Offer GuidanceSupport with evaluating offers, understanding CTC structure, and salary negotiation basics so you make an informed decision on your first data analyst role in Bangalore.
Data Analyst Interview Questions Asked in Bangalore Companies
These are the types of questions Bangalore companies ask in data analyst interviews in 2026. Every topic below is covered in the Vtricks curriculum so you can answer with confidence and with actual project examples to back it up.
Tool
Interview Question
What the Interviewer is Testing
SQL
Write a query to find the top 3 customers by revenue in each city using a window function.
How would you use an AI tool to speed up your SQL query writing? What are the risks?
Practical GenAI awareness, critical thinking about output validation
All seven topics above are covered in the data analytics course in Bangalore at Vtricks Technologies through hands-on labs and project work. By the time you sit for an interview, these will not be new questions they will be things you have already done.
Big Data Courses in Bangalore How Data Analytics Connects
Many students searching for big data courses in Bangalore or big data coaching in Bangalore are actually looking for a strong foundation in data analytics first and that is the right starting point. Big data tools like Hadoop and Apache Spark are designed to process data at a scale that most companies do not deal with until they grow significantly. Before a team needs Spark, they need analysts who can work with SQL, Python, and Power BI effectively. That is where the real hiring demand sits in Bangalore in 2026.
The data analytics training in Bangalore at Vtricks gives you the Python and SQL foundation that big data engineering roles build on. Students who want to move toward data engineering after completing the analytics course will find that Pandas, NumPy, and SQL all covered in the Vtricks curriculum directly transfer to Spark and cloud data warehouse environments. The path from data analyst to junior data engineer is one of the most common career progressions in Bangalore's tech sector, and the Vtricks course is structured to support it.
If you are specifically looking for big data classes in Bangalore that cover Hadoop, Spark, or NoSQL at an advanced level, Vtricks also offers a dedicated big data analytics program. Speak to the admissions team to understand which program is the right fit for your current skill level and career goal.
Data Analytics Institute in Bangalore About Vtricks Technologies
Vtricks Technologies was founded in 2019 and operates from its campus at 1st Floor, #52 E, Bhairaveshwara Nilaya, 15th Main Road, Vijayanagar, Bangalore 560040 a 5-minute walk from Vijayanagar Metro Station. The institute is a VTU-approved training partner and holds recognition from IBM, Microsoft, and AWS.
The data analytics program is led by Vinay Haritsa, a data science professional and alumnus of Amrita University with hands-on experience across Python, machine learning, and business analytics. Vinay has been training students since the institute's founding and is specifically named in student reviews for his ability to make complex statistical and programming concepts approachable for non-technical learners.
Since 2019, Vtricks has placed 500+ students into data analyst, business analyst, SQL developer, and BI analyst roles at companies across Bangalore including Sigmoid Analytics, Tech Mahindra, and Epic Minds. The placement network continues to grow across the city's IT, fintech, healthcare, and e-commerce sectors. Batch sizes are kept small maximum 15 students to ensure every student gets direct trainer access and personalised placement support.
Common questions from students before enrolling in our data analytics training program at Vijayanagar, Bangalore.
The data analytics course fee at Vtricks Technologies, Bangalore is ₹32,000 all-inclusive with no hidden charges. This covers all tools, datasets, live projects, VTU-approved certification, and placement support. EMI is available from ₹1,499 per month for 24 months.
Vtricks Technologies is a VTU-approved data analytics institute at Vijayanagar, Bangalore, recognized by IBM, Microsoft, and AWS. Training is led by industry professionals with real experience in data science and analytics. The institute has placed 500+ students since 2019 into data analyst, business analyst, and BI analyst roles across Bangalore companies.
Yes. The course is designed for freshers, recent graduates, and career-switchers from non-IT backgrounds. No prior coding experience is required. The curriculum starts from statistics and Excel basics, progresses through SQL and Python, and finishes with Power BI dashboards and real industry projects.
Data analyst salary in Bangalore ranges from ₹3–6 LPA for freshers, ₹7–12 LPA for mid-level professionals with 2–4 years experience, and ₹15–25 LPA for senior analysts. Data analysts with GenAI tool skills earn 25–35% above these ranges in 2026, according to Naukri JobSpeak salary data.
The course runs for 3 to 6 months depending on the batch. Weekday morning and evening batches complete in 3–4 months. The weekend batch runs over 5–6 months. All batches cover the full curriculum including the 2026 GenAI module, live projects, and placement preparation.
Yes. Placement support is included in the ₹32,000 fee at no extra charge. It covers resume building, LinkedIn optimisation, mock interviews (SQL, Python, statistics, Power BI), job referrals through the hiring network, and offer guidance. Preparation starts from week one, not after the course ends.
The course covers SQL, Python (Pandas, NumPy, Matplotlib, Seaborn), Microsoft Excel and Advanced Excel, Power BI (including DAX and data modelling), Tableau, and GitHub for portfolio building. The 2026 batch also includes a dedicated GenAI tools module covering natural language to SQL, Copilot in Power BI, and AI-assisted dashboard analysis.
Yes. Vtricks Technologies offers the data analytics course in both classroom and live online formats. Classroom training is at the Vijayanagar campus, Bangalore. Online batches are instructor-led live sessions with recorded backup access for revision.
The four types are: Descriptive analytics (what happened historical data and dashboards), Diagnostic analytics (why it happened root cause and drill-down analysis), Predictive analytics (what will happen statistical models and forecasting), and Prescriptive analytics (what action to take optimisation and recommendation systems). All four are covered in the Vtricks curriculum.
No prior coding is required. The course begins with Excel and statistics, then teaches SQL and Python from scratch with guided practice. Most students who joined with zero programming background were writing SQL queries within the first month. Coding in data analytics is closer to logical, step-by-step querying than software development.
Yes. The weekday morning and evening batches complete the full curriculum in 3–4 months, including SQL, Python, Power BI, statistics, the 2026 GenAI module, and live projects. If you can commit 1.5 hours a day on weekdays, 3 months is realistic. The weekend batch takes 5–6 months at a lighter pace.
A data analyst extracts, cleans, and interprets data using SQL, Excel, Python, and BI tools to answer business questions and build dashboards. A data scientist goes further into machine learning models and algorithms. Data analyst roles have lower entry barriers, more openings for freshers in Bengaluru, and are the standard starting point before moving into data science.
Yes. Analytics and data roles in Bangalore have grown consistently year on year, and companies across IT, fintech, e-commerce, and healthcare hire data analysts every month. Analysts who combine SQL, Power BI, and GenAI tool skills earn 25–35% above standard packages in 2026, making it one of the most reliable career switches for non-IT graduates.
Yes. The data analyst course at Vtricks is built for non-IT students — BCom, BBA, BSc, and BA graduates make up a large share of every batch. The curriculum assumes no technical background and covers everything from spreadsheet basics to Python and dashboards. Placement support is the same for IT and non-IT students.
The campus is at Vijaynagar, a 5-minute walk from Vijaynagar Metro Station on the Purple Line. Students commute from Rajajinagar, Nagarbhavi, Basaveshwaranagar, Malleshwaram, Kengeri, Mysore Road, Magadi Road, and central Bengaluru via Majestic. Live online batches are available for students elsewhere in the city or outside Bangalore.
You receive a VTU-approved certification from Vtricks Technologies, along with recognition from IBM, Microsoft, and AWS partner programs. This is a skills certification earned by completing projects and assessments during the course — not a participation certificate — and it can be verified by recruiters.
Yes. You can attend a free demo session at the Vijaynagar campus or online before enrolling. The demo covers how the batches run, the tools taught, the placement process, and lets you interact with the trainer directly. Call or fill the enquiry form on this page to book a slot for the next demo.
Student Reviews
Real feedback from students who completed the data analytics course at Vtricks Technologies, Vijayanagar Bangalore
★★★★★4.8 / 5(Verified Student Reviews)
"I came from an MBA Business Analytics background with no programming experience. Vtricks taught me everything from installation to actual data analysis. I got placed through their placement assistance program and I highly recommend the institute to everyone."
Santoshi PMBA to Data Analytics Placed via Vtricks
"I did the data analytics course in 2021. The teaching faculty were very good and approachable. They allowed us to work on real-time projects which really helped me answer interview questions. After a few years, when I wanted to switch jobs, they supported and guided me again for placements."
Navya NData Analytics Placed & Re-placed via Vtricks
"The program covered comprehensive hands-on training in Python, MySQL, and Power BI data cleaning, visualization, and dashboard creation. The projects were practical and closely aligned with industry requirements. My performance led to an internship opportunity at Epic Minds which strengthened my analytics skills."
Nirmala RData Analysis Course Interned at Epic Minds
Conveniently located near the Vijaynagar Metro Station, serving students from Nagarbhavi, Rajajinagar, Basaveshwaranagar, Malleshwaram, Kengeri, Mysore Road, Magadi Road, and across Bengaluru. Direct Purple Line metro access from Majestic and Attiguppe makes the campus easy to reach from any part of the city.